

Market Structure , Trends & Price Action
1. What Is Market Structure?
Market structure is the way price moves through highs and lows over time.
It helps you identify whether the market is trending upward, trending downward, or moving sideways.
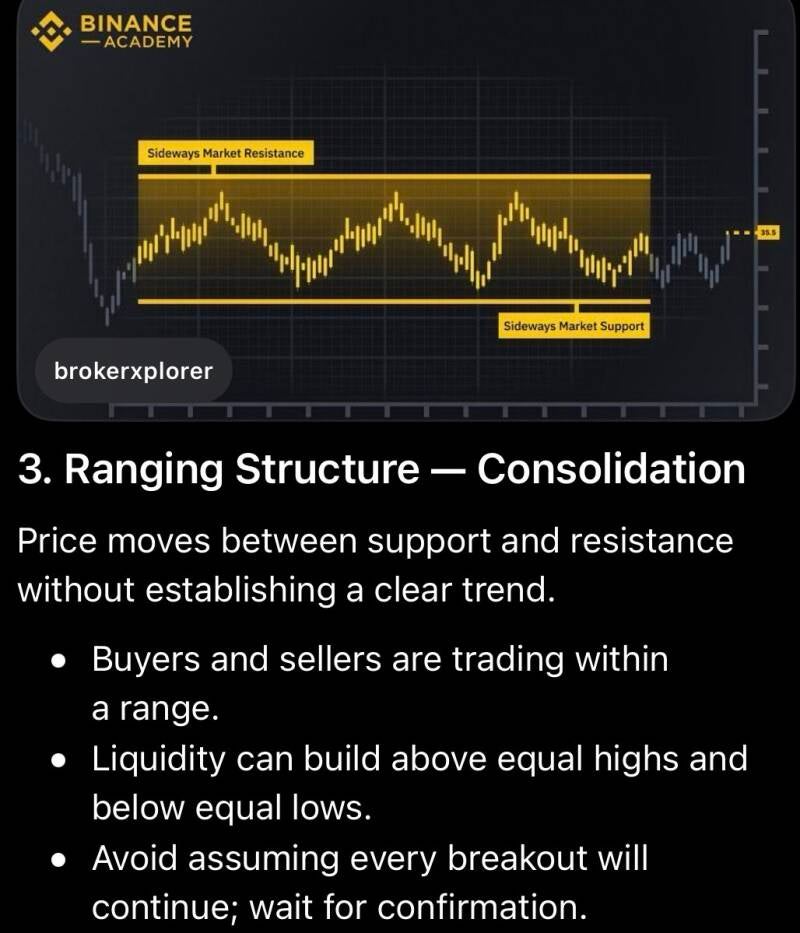
There are three main market conditions.


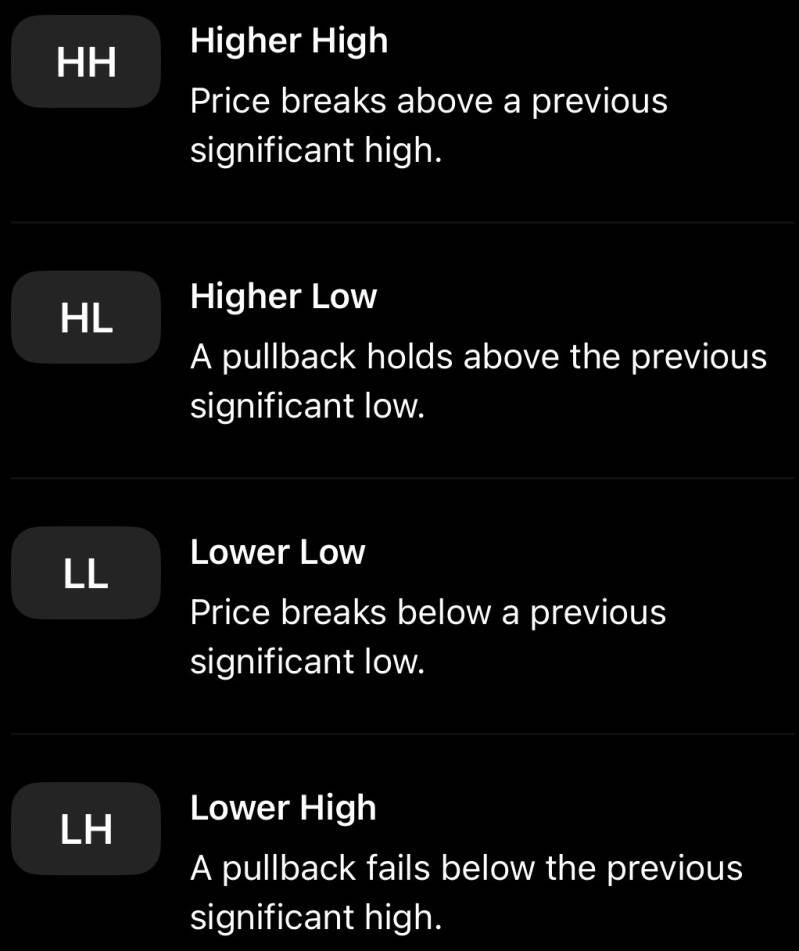
4 Structure Terms You Must Know
What is Price Action ?
Price action is the movement of price itself, interpreted through candlesticks, swings, momentum, and reactions at important levels.
Instead of relying only on indicators, you study what buyers and sellers are doing on the chart.
Price action helps you answer four questions:
Is price moving with strength or weakness?
Is price rejecting or accepting an important level?
Is momentum increasing or slowing?
Is there confirmation to enter, or should I wait?
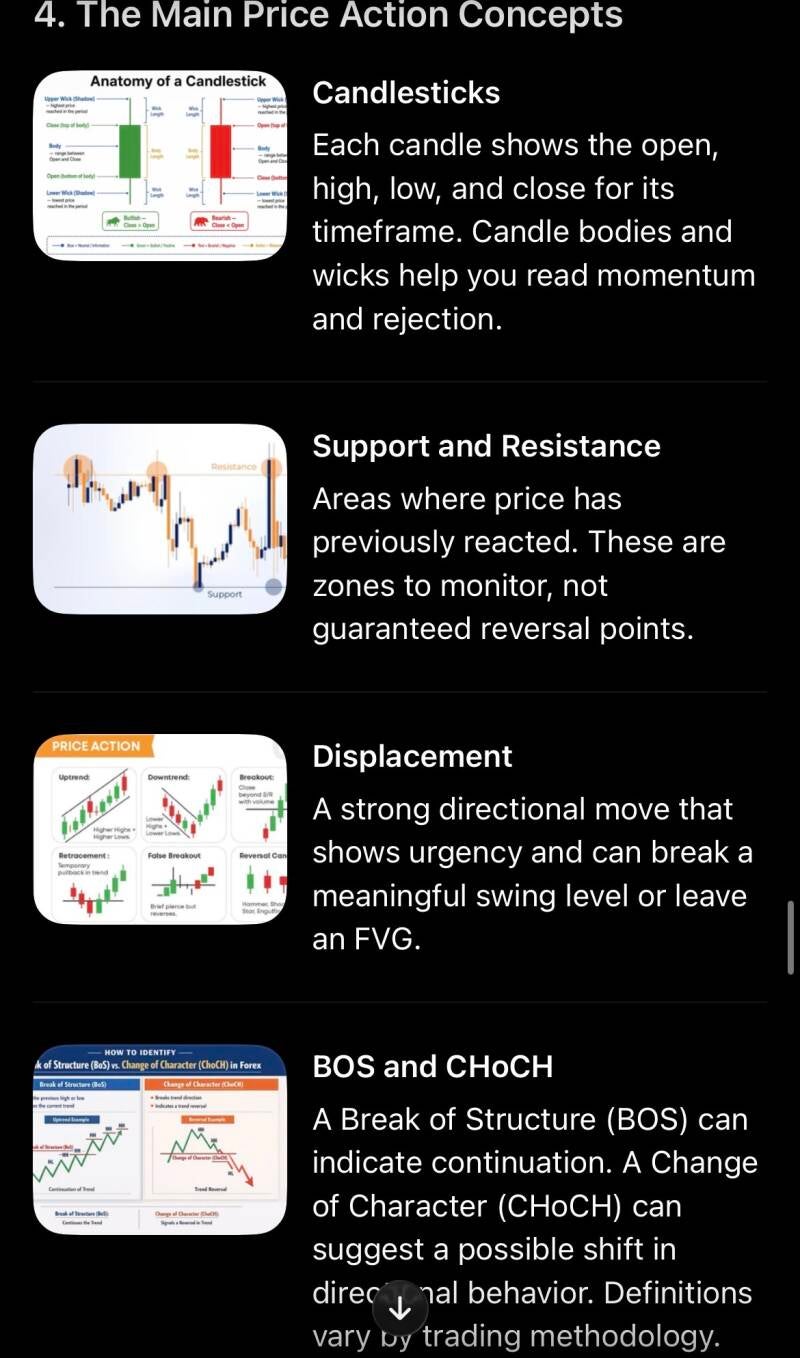
BOS VS CHoCh - What's the difference ?
BOS — Break of Structure
A break of a meaningful swing level that often supports the current trend's continuation.
Example: bullish market forms HH and HL, then breaks above the previous HH.
CHoCH — Change of Character
An early potential signal that the market may be shifting direction.
Example: bearish market forms LL and LH, then price breaks above a significant LH.
A wick through a level is not always a confirmed structural break. Many traders look for a candle close and meaningful follow-through.
Trend Pullback
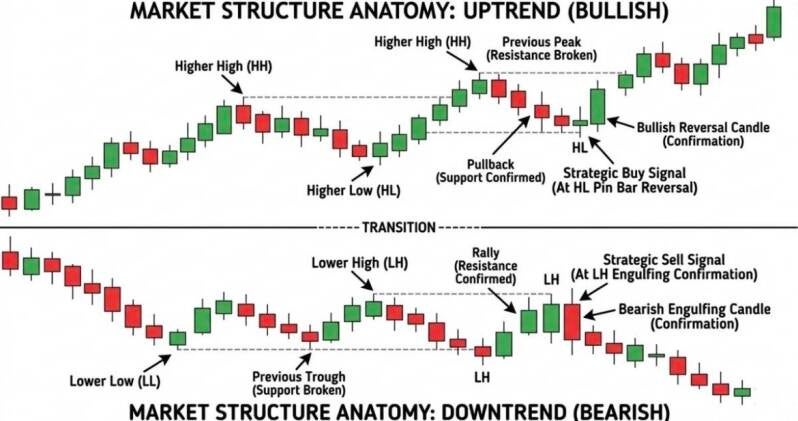
A pullback is a temporary move against the prevailing trend.
Bullish example:
1. Price moves upward.
2. Price pulls back.
3. The pullback holds above the previous important low.
4. Buyers return and price may continue upward.
A pullback is not automatically a reversal. Wait for your confirmation.
Support & Resistance
1. What is Support?
Support is a price area where downward movement may slow or reverse because buying pressure becomes strong enough to challenge selling pressure.
Think of support as a floor beneath the price.
Price falls toward a support area.
Buyers may step in.
Selling pressure may weaken.
Price may bounce upward.
2. What is Resistance?
Resistance is a price area where upward movement may slow or reverse because selling pressure becomes strong enough to challenge buying pressure.
Think of resistance as a ceiling above the price.
Price rises toward a resistance area.
Sellers may step in.
Buying pressure may weaken.
Price may reject downward.
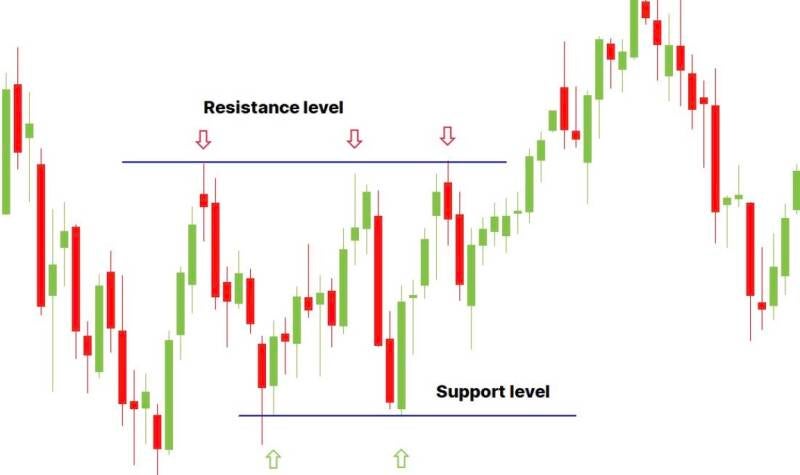
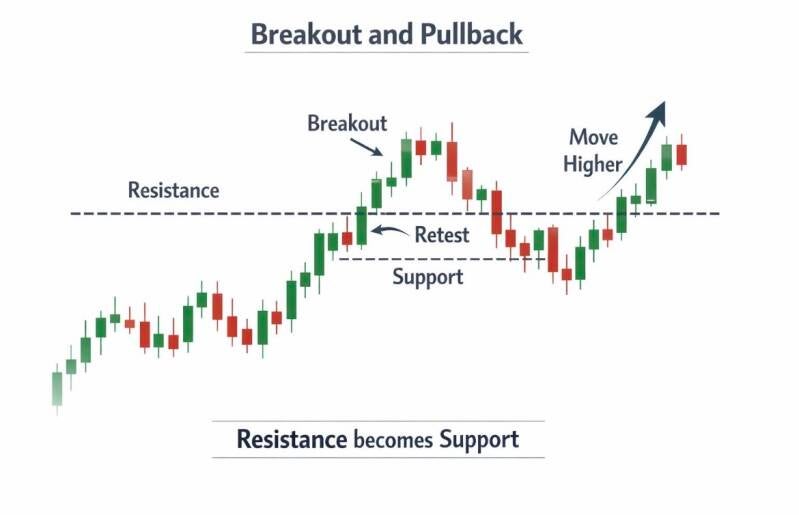
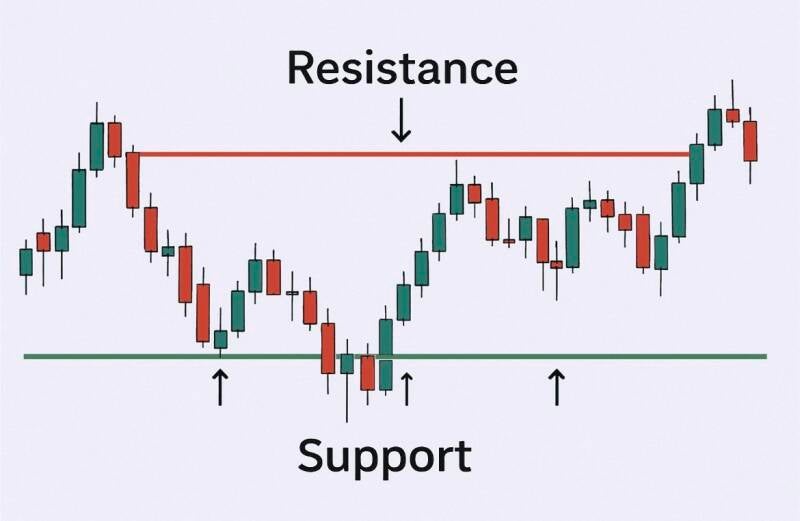
Support Vs Resistance
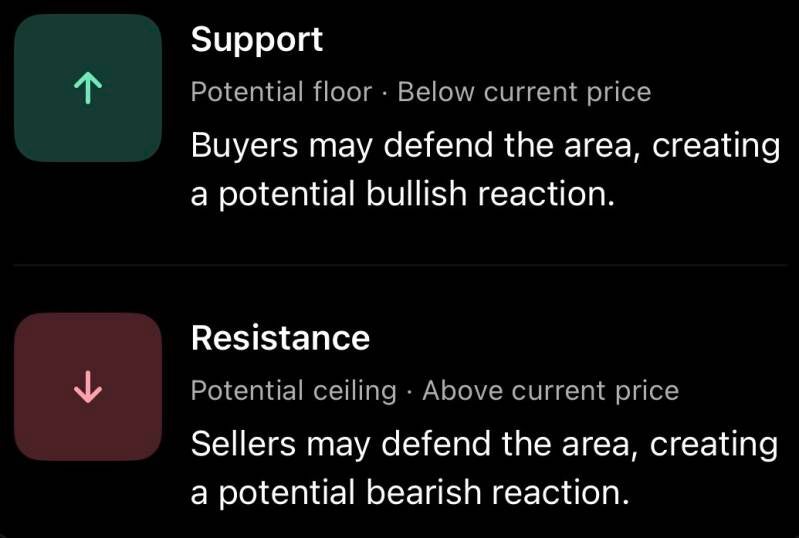
How to identify support and resistance
Look for these clues on your chart:
Repeated reactions: Areas where price has reversed or stalled more than once.
Swing highs and lows: Previous turning points where price changed direction.
Strong displacement: Areas associated with a powerful move away from a price level.
Higher-timeframe levels: Important zones on the 4H and 1H charts that can provide context for your entries.
Psychological numbers: Round numbers, such as 20,000 on NAS100 or 3,000 on Gold, that traders may pay attention to.
The Support to Resistance Flip
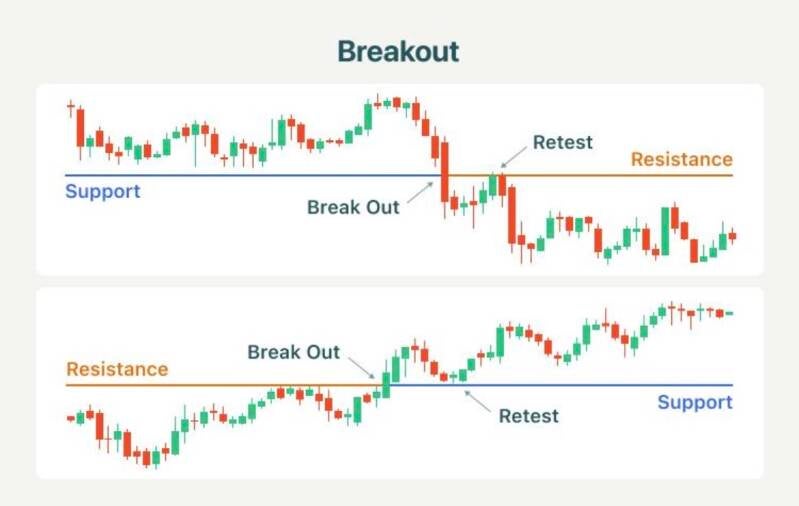
A key concept to learn is role reversal.
When price breaks below support, that former support area may act as resistance on a later retest.
When price breaks above resistance, that former resistance area may act as support on a later retest.
Create Your Own Website With Webador